At a glance
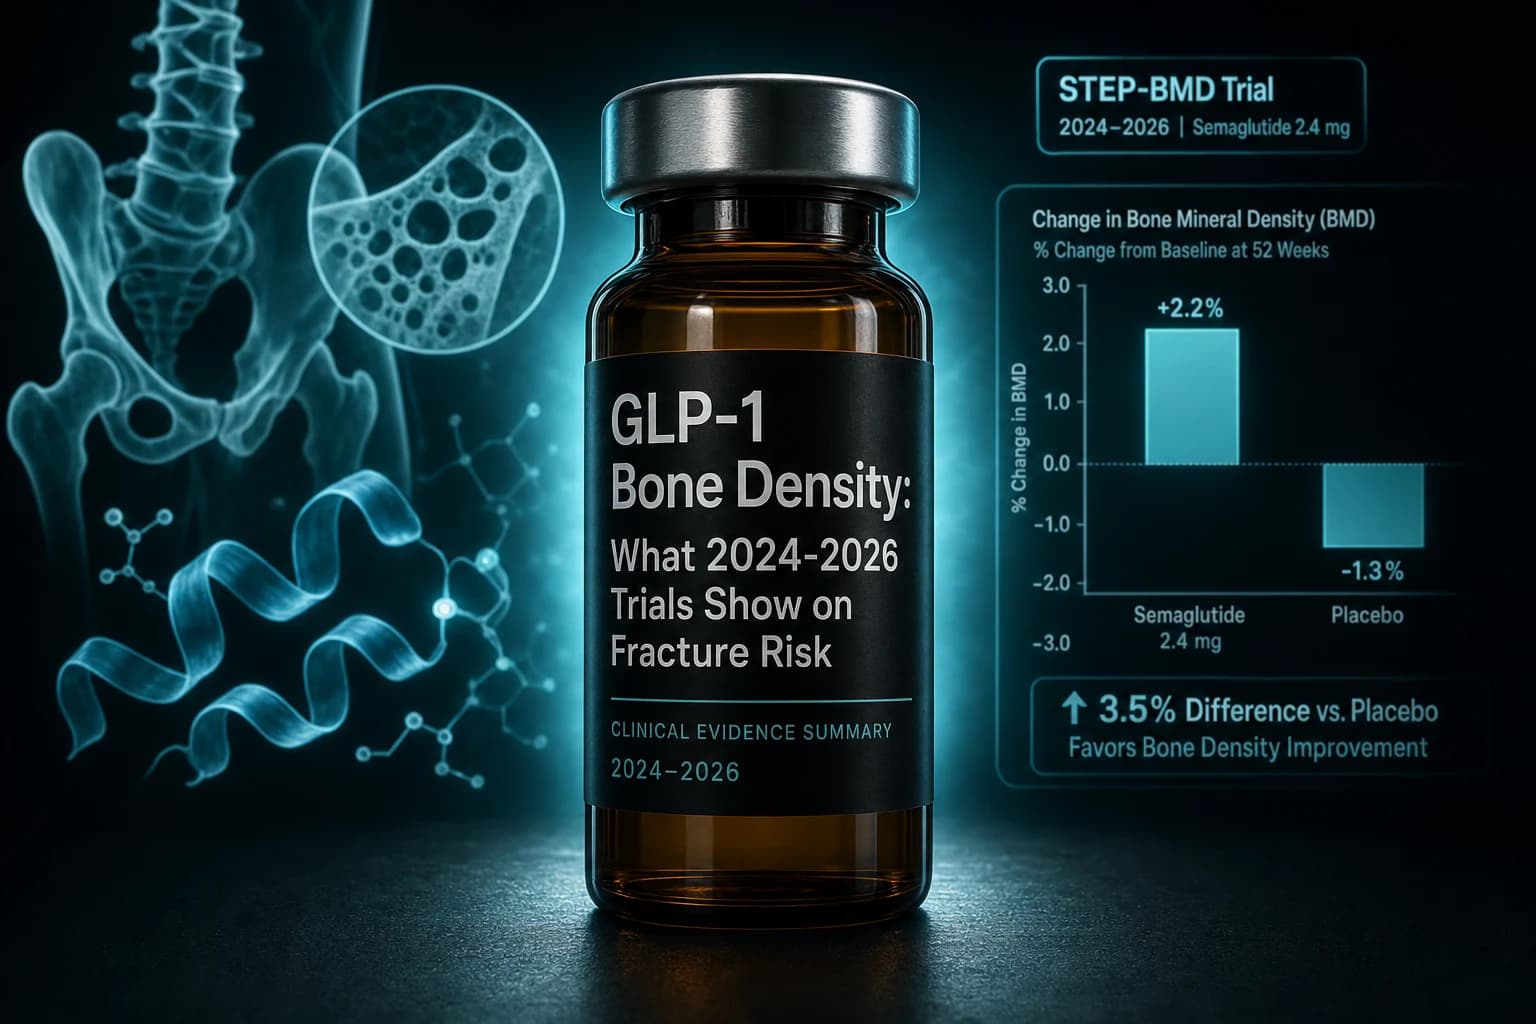
- Hansen 2024 phase 2 RCT (PMID 38737002): semaglutide 1.0 mg cut total hip BMD ~2.6% and lumbar spine BMD ~2.1% versus placebo at 52 weeks in adults with elevated fracture risk
- Liu 2026 JCEM DXA cohort (PMID 41655226): 255 semaglutide/tirzepatide users lost 1.6-2.8% BMD across hip and spine at a median 17 months, with total hip loss tracking with the amount of weight lost
- SURMOUNT-1 body-composition substudy (PMID 39996356): about 25% of tirzepatide-driven weight loss came from lean mass at week 72, the same ratio as placebo, but absolute lean-mass loss was 10.9% versus 2.6%
- Israeli retrospective cohort 2026 (Kasher Meron et al.): HR 1.26 for fragility fracture in adults aged 65-75 on GLP-1s versus DPP-4 or SGLT2 comparators, with no signal in adults 75+
- Mechanism is dominated by the weight loss itself, not the molecule, so the only well-supported countermeasures are resistance training and adequate protein intake during the calorie deficit
The bone question nobody was asking in 2021
When STEP 1 published in 2021 (Wilding et al., NEJM, PMID 33567185), semaglutide for obesity was framed as a body weight story. Fat mass came off. Cardiometabolic markers improved. The bone density signal in that trial was a footnote in an exploratory body composition substudy.
Five years and several million prescriptions later, bone is no longer a footnote. A randomized trial designed specifically to read out skeletal effects has been published (Hansen et al., eClinicalMedicine 2024, PMID 38737002). A retrospective DXA cohort in patients at elevated fracture risk landed in the Journal of Clinical Endocrinology and Metabolism in early 2026 (Liu et al., JCEM 2026, PMID 41655226). And a 46,177-patient Israeli cohort published in the same journal flagged a modest fracture-risk signal in older adults with type 2 diabetes (Kasher Meron et al., 2026). The picture is no longer empty. It is messy.
The sections below walk through what the BMD-specific evidence actually shows on semaglutide and tirzepatide, how to read the contradiction between the controlled DXA trials and the larger fracture-incidence cohorts, and where the evidence is still too thin to make a confident claim.
Bottom line: Across the few studies that have actually measured bone with DXA, GLP-1 users lose 2 to 3 percent of total hip and lumbar spine BMD over 12 to 17 months, the loss tracks with the amount of weight lost rather than the drug itself, and the population-level fracture-risk signal is modest, age-dependent, and inconsistent across cohorts.
What bone density loss on GLP-1s actually means
"Bone density loss" gets used loosely. The published GLP-1 evidence is built on three distinct measurements that do not necessarily move together.
| Measurement | What it captures | Time to detect | GLP-1 evidence so far |
|---|---|---|---|
| DXA areal BMD (g/cm²) | Bone mineral per projected area at the hip, spine, or femoral neck | 12 to 24 months | Consistently down 1.6 to 2.8% on semaglutide or tirzepatide (Hansen 2024, Liu 2026) |
| Bone turnover markers (P1NP, CTX) | Active formation and resorption rates | Weeks | Resorption (CTX) up, formation (P1NP) flat on semaglutide (Hansen 2024) |
| Fracture incidence | Actual clinical fractures over time | Years and large samples | Mixed, age-dependent, signal sits in older T2D cohorts (Kasher Meron 2026); a separate TriNetX vertebral analysis found lower risk on GLP-1s (Khor 2025/2026) |
DXA loss does not automatically translate into more fractures. A 2 to 3 percent BMD loss is small relative to the 5 to 10 percent annual loss seen with high-dose glucocorticoids, and people losing weight by any method generally lose some BMD, particularly at the hip. What makes the GLP-1 picture worth taking seriously is that the loss is happening fast, the resorption marker (CTX) is rising while the formation marker (P1NP) is flat, and the average patient is staying on the drug for years.
Hansen 2024: the only randomized BMD-specific trial
The cleanest evidence is a small but tightly designed phase 2 trial from Denmark published in The Lancet's eClinicalMedicine in May 2024 (Hansen et al., PMID 38737002).
- Design: Randomized, double-blind, placebo-controlled, two-center, 52 weeks.
- Population: 64 adults at elevated fracture risk (T-score below -1.0 at the total hip or lumbar spine, or a low-energy fracture within the past three years).
- Intervention: Once-weekly subcutaneous semaglutide 1.0 mg versus placebo, 1:1.
- Primary endpoint: Change in plasma P1NP (a bone formation marker) from baseline to week 52.
- Headline result: Semaglutide did not increase bone formation. P1NP was flat, while CTX (the bone resorption marker) rose, and areal BMD at the total hip and lumbar spine declined by an estimated 2.6 percent and 2.1 percent versus placebo respectively.
The trial was small, and a 64-person sample at one Northern European center cannot answer a fracture-incidence question. What it does establish is that under randomized conditions, in a population specifically enriched for low baseline BMD, semaglutide at a diabetes-grade dose moved bone metabolism in the wrong direction over one year.
Two things to note. First, the 1.0 mg semaglutide dose used in Hansen is below the 2.4 mg Wegovy dose now used for obesity, and below the 3.0 mg high-dose tier; bone losses on higher doses have not been characterized in a randomized trial. Second, the trial was not powered for fracture outcomes, so it cannot rule in or out a clinical fracture signal at any dose.
Liu 2026: the larger DXA cohort
The Liu et al. retrospective cohort from a single US center, published in JCEM in early 2026, provides the larger DXA sample at the cost of being non-randomized (PMID 41655226).
- Design: Single-center retrospective cohort with matched non-users.
- Population: 255 adults using semaglutide or tirzepatide for at least 6 months with DXA scans before and at least 6 months after initiation. 92% female, mean age 64, mean BMI 31.
- Comparator: 255 matched non-users with comparable DXA scans.
- Follow-up: Median 17 months.
- Weight loss: Median 5 percent in the GLP-1 group.
- Findings: Statistically significant declines from baseline at the lumbar spine (-1.6%), femoral neck (-1.8%), and total hip (-2.8%) in the GLP-1 group. The total hip decline was significantly associated with the amount of weight lost.
- Baseline skeletal status: 56% had osteopenia and 14% had osteoporosis at baseline; both proportions rose during follow-up.
The dose-response shape matters. Patients who lost more weight lost more bone at the total hip, which is the same pattern seen in classical bariatric and dietary weight-loss studies. That is consistent with weight loss being the dominant mechanism rather than a direct drug effect on osteoblasts. It is also consistent with the Hansen RCT, where the most parsimonious explanation for the BMD decline is the modest weight loss driving accelerated bone turnover, not a unique pharmacologic action of the GLP-1 receptor on bone.
Note: The Liu cohort enriched for fracture risk at baseline. The 14% osteoporosis prevalence and 56% osteopenia prevalence are far higher than a general semaglutide user. The findings should not be extrapolated as the expected BMD trajectory for a 35-year-old taking Wegovy for cosmetic weight loss with normal baseline bone. They describe what happens when GLP-1s are layered on top of pre-existing skeletal fragility.
Population-level fracture data: a contradictory picture
Two large 2026 cohorts looked at clinical fractures rather than DXA changes, and the signals point in opposite directions.
The Israeli cohort (Kasher Meron et al., JCEM 2026) drew from a national health-fund database. 46,177 adults aged 65 or older with type 2 diabetes initiated either a GLP-1 agonist (n=11,257, mostly semaglutide or dulaglutide) or a comparator (n=34,920, DPP-4 or SGLT2 inhibitor) between 2018 and 2022. During a median 34.7 month follow-up, 8.8 percent had a fragility fracture. The adjusted hazard ratio for fragility fracture on GLP-1 versus comparator was 1.11. The signal concentrated in the 65 to 75 age band (HR 1.26) and was not present in adults 75 or older. The comparison against DPP-4 inhibitors was significant (HR 1.15); the comparison against SGLT2 inhibitors was not.
The TriNetX vertebral cohort (Khor et al., JAMA Surgery 2025-2026) used a global EHR database, propensity-matched 193,563 GLP-1 users and non-users with type 2 diabetes, and found the opposite. GLP-1 users had lower odds of vertebral compression fractures (1.5% vs 1.8%, OR 0.83) and lower odds of vertebroplasty or kyphoplasty (OR 0.80).
Both cohorts are observational and prone to confounding, but the methodological differences explain most of the contradiction:
- Anatomic site. The Israeli cohort defined the endpoint as any fragility fracture (hip, pelvis, vertebrae, forearm, humerus, rib). The TriNetX analysis isolated vertebral compression. Hip fractures are the strongest weight-loss-sensitive fracture type. Vertebral fractures are more closely tied to glycemic control and prior fragility.
- Comparator drug class. Comparing GLP-1 against DPP-4 or SGLT2 (Israel) versus comparing against any non-user (TriNetX) changes the baseline fracture probability of the reference group. DPP-4 inhibitors are roughly neutral on bone; SGLT2s, particularly canagliflozin, have their own fracture signal, which is why the GLP-1 versus SGLT2 contrast did not separate.
- Population. Older, exclusively T2D adults in Israel; younger, broader mixed-T2D adults in TriNetX.
- Follow-up depth. A 35-month median in Israel versus shorter analytic windows in TriNetX cohorts.
The clean read across the two cohorts is that GLP-1s, at the population level, are not catastrophic for fracture risk. The Israeli signal in adults 65 to 75 is real and warrants attention. The TriNetX vertebral-only signal does not erase the Israeli finding; it speaks to a different anatomy in a different population.
Lean mass and bone go together
The body composition data on GLP-1s help explain why the bone signal exists at all. In the SURMOUNT-1 DXA substudy (Look et al., Diabetes Obes Metab 2025, PMID 39996356), 160 of the 2,539 SURMOUNT-1 participants had DXA at baseline and week 72. Tirzepatide users lost 21.3 percent of body weight, 33.9 percent of fat mass, and 10.9 percent of lean mass. Placebo lost 5.3, 8.2, and 2.6 percent respectively.
The fat-to-lean ratio was about 75:25 in both arms, which Lilly framed as a favorable result because lean mass loss was proportional rather than disproportionate. That framing is correct for the ratio. It is incomplete for the absolute number. Losing 10.9 percent of lean mass over 72 weeks means measurable losses in muscle and likely in bone-supporting soft tissue at the same time the BMD is declining.
For the broader lean-mass picture on the GLP-1 class, the GLP-1 muscle loss research roundup covers the strategies that hold up across the class. The same protein-and-resistance-training playbook is also the only well-supported intervention for limiting bone loss during weight loss.
Is it the drug or the weight loss?
The mechanistic question matters because it determines whether the bone risk is a class effect, a dose effect, or a weight-loss effect.
Three lines of evidence point toward weight loss as the dominant driver:
- Magnitude correlates with weight lost. Liu 2026 showed total hip BMD loss tracked with the amount of weight lost. Classical bariatric surgery cohorts show similar patterns: more aggressive weight loss, more BMD loss at the hip.
- The signal pattern matches caloric restriction. Resorption (CTX) up, formation (P1NP) flat is the classic fingerprint of energy-deficit-driven bone turnover, not a specific receptor-mediated effect on osteoblasts.
- Bariatric surgery shows the same loss in the absence of any GLP-1 drug. Sleeve gastrectomy and Roux-en-Y both drive comparable hip BMD declines in the first 12 to 24 months. The presence of a GLP-1 receptor agonist is not required.
Two lines of evidence keep the direct-drug-effect hypothesis alive:
- Preclinical data. GLP-1 receptors are expressed on osteoblasts and osteoclasts. Effects on bone metabolism in animal models exist, although direction and magnitude vary.
- Effect appears at modest weight loss. The Hansen 2024 RCT used 1.0 mg semaglutide, which produces only modest weight loss at that dose. A 2 to 3 percent BMD decline in 52 weeks at a low-weight-loss dose suggests the drug could be contributing on top of the energy deficit, although the trial cannot fully separate the two.
The honest read is that the weight loss explains most of the signal, the drug class probably contributes a small additional effect, and dose is likely to matter on the BMD axis the same way it matters on the weight-loss axis. The 2.4 mg Wegovy dose and the 15 mg tirzepatide dose, both of which produce 15 to 22 percent weight loss, have not been characterized in randomized BMD trials. That is the most important gap in the current evidence.
Tirzepatide versus semaglutide on the bone axis
Direct head-to-head BMD data on tirzepatide versus semaglutide do not exist. The available evidence allows only an indirect comparison:
| Metric | Semaglutide 1.0 mg (Hansen 2024) | Tirzepatide (SURMOUNT-1 DXA) | Notes |
|---|---|---|---|
| Trial design | Randomized BMD-primary | DXA substudy of obesity RCT | Not directly comparable |
| Duration | 52 weeks | 72 weeks | Tirzepatide longer |
| Mean weight loss | Modest (low dose) | -21.3% (pooled doses) | Tirzepatide far larger |
| Fat-to-lean ratio | Not the focus | ~75:25 | SURMOUNT-1 substudy |
| Total hip BMD change | -2.6% vs placebo | Not directly reported | Liu 2026 pools both classes |
| Lumbar spine BMD change | -2.1% vs placebo | Not directly reported | Liu 2026 pools both classes |
The Liu 2026 cohort treated semaglutide and tirzepatide as a single class, so it does not distinguish them. A reasonable working hypothesis is that the larger the weight loss, the larger the BMD loss, which would make higher-dose tirzepatide and high-dose retatrutide candidates for the largest absolute BMD declines per year on treatment. That hypothesis is unconfirmed and would need a dedicated DXA RCT to settle.
For the head-to-head efficacy data that does exist, the retatrutide vs tirzepatide vs semaglutide 2026 comparison walks through the SURMOUNT, SURPASS, and TRIUMPH series side by side.
Practical implications
The data do not justify panic. They do justify thinking about bone the same way researchers think about lean mass during a GLP-1 cycle.
Risk concentrates in identifiable subgroups:
- Postmenopausal women, particularly those with baseline T-scores below -1.0
- Adults aged 65 to 75 with type 2 diabetes (the Kasher Meron signal)
- Anyone with a prior low-energy fracture in the past three years
- Patients losing more than 15 percent of body weight in under a year
- Patients on the highest dose tier of semaglutide, tirzepatide, or retatrutide
What the published evidence supports as protective:
- Resistance training. Progressive load is the only intervention with consistent BMD-positive effects during weight loss across non-GLP-1 trials.
- Adequate protein intake. Achievable targets in the 1.2 to 1.6 g per kg body weight per day range are commonly recommended; this is supportive of both lean mass and bone matrix turnover.
- Calcium and vitamin D sufficiency. Baseline-level dietary or supplemented intake; this is foundation rather than countermeasure.
- Baseline DXA before initiation. For higher-risk subgroups, a baseline DXA establishes the trajectory and identifies cases where the drug should be coordinated with osteoporosis-specific management.
- Avoiding the steepest dose ramps when possible. A slower ramp produces a slower weight-loss curve, which produces a slower BMD curve in the cohort data.
What the published evidence does not support:
- Routine prescription of antiresorptives (bisphosphonates, denosumab) purely on the basis of being on a GLP-1. None of the published trials tested antiresorptive co-administration during GLP-1 use.
- Specific peptide-based "bone protection" stacks. The peptides sometimes promoted for bone (BPC-157, MK-677, sermorelin, tesamorelin) have no published BMD-endpoint trials in GLP-1 users.
- Stopping the GLP-1 in patients with strong cardiometabolic indications. The bone signal has to be weighed against documented benefits like the SELECT MACE reduction (Lincoff et al., NEJM 2023, PMID 37952131) and the SELECT cardiovascular MACE evidence.
For the broader research-use picture on stopping GLP-1s, the stopping GLP-1s and weight regain research covers the maintenance and rebound data, which also bears on the bone question (regained weight does not generally restore BMD lost during the deficit).
What the data don't say
Five gaps are worth flagging explicitly:
- High-dose, longer-duration BMD. No randomized trial has measured BMD on semaglutide 2.4 mg, tirzepatide 15 mg, or retatrutide 12 mg out to 2 to 5 years. All of the current data are at low doses or short windows.
- Younger, otherwise healthy users. The published cohorts are skewed older and toward T2D or elevated baseline fracture risk. The 30-year-old non-diabetic Wegovy user with normal baseline bone is essentially unstudied.
- Resistance training as a randomized comparator. Observational data support resistance training as protective. The randomized trial that adds structured resistance training as a co-intervention during GLP-1 treatment and reads out BMD has not been done at scale.
- Tirzepatide and retatrutide head-to-head on bone. Without dedicated DXA arms in the SURMOUNT and TRIUMPH programs, no rigorous comparison is possible.
- The non-injectable GLP-1 class. Oral semaglutide and oral orforglipron have not generated BMD-specific data. Whether the bone signal is shared by the oral small molecule class is open. For the orforglipron evidence picture, the orforglipron oral GLP-1 phase 3 evidence walks through what is in the public record.
Warning: Self-administered research-use GLP-1 protocols do not include baseline or follow-up DXA in any standard form. Researchers running their own protocols without baseline bone density data have no way to characterize their personal trajectory. The Hansen RCT magnitude (2 to 3 percent over a year) is small enough that subjective symptoms will not detect it, and is large enough to matter cumulatively over multi-year exposure.
Where to source verified material
For researchers running their own studies on the injectable GLP-1 class, vial purity matters before any of the bone-density conversation is relevant. Independent COA verification (HPLC purity, mass spec confirmation) is the floor. Available from Ascension Peptides with 50% off using code ENHANCED for the injectable GLP-1 line including semaglutide, tirzepatide, and retatrutide vials with batch-level COA publication.
For broader reconstitution math across any vial size, the peptide reconstitution complete guide is the reference. For semaglutide 5 mg specifically, the semaglutide reconstitution chart and the live reconstitution calculator handle the unit math.
Bottom line
- The randomized BMD-specific evidence on semaglutide consists of one 64-person phase 2 trial (Hansen 2024, PMID 38737002), and it showed 2 to 3 percent BMD loss at the total hip and lumbar spine over 52 weeks.
- The largest DXA cohort to date is 255 semaglutide or tirzepatide users with 255 matched controls (Liu 2026, PMID 41655226), and it showed similar magnitude losses with the total hip change tracking the amount of weight lost.
- Population-level fracture data are mixed: a modest 11 percent excess risk for fragility fractures in older adults with T2D in one cohort, lower vertebral fracture risk in another. Both are observational.
- Lean mass loss runs in parallel (SURMOUNT-1 DXA substudy, PMID 39996356), so the protein-and-resistance-training playbook for muscle is also the right playbook for bone.
- The dominant mechanism appears to be the weight loss itself, with a possible small additive drug effect. Higher doses and higher weight-loss magnitudes are the most likely to produce the largest BMD declines, but the high-dose RCT data are not yet published.
This article is for educational and informational purposes only. It is not medical advice. The evidence summarized here comes from peer-reviewed clinical trials and observational cohorts. Decisions about GLP-1 initiation, dose selection, or co-management of skeletal health require individual assessment by a qualified clinician familiar with the patient's full medical history, baseline bone density, fracture risk profile, and concurrent medications. Semaglutide, tirzepatide, and retatrutide carry documented risks including gastrointestinal adverse events, pancreatitis, gallbladder disease, contraindications in medullary thyroid carcinoma, and potential for hypoglycemia when combined with insulin or sulfonylureas. Self-administration outside a clinical setting is not endorsed.